




Infographics

Infographics visualise data, information and knowledge in a simple way, conveying key messages and ideas to your audience.
Graphics, such as charts, maps and icons, enhance the impact of information, as well as making it easier to understand.
JONO Design creates infographics that reveal what is important, helping to intepret data and getting across what you want to say.

Examples of infographic design projects
Click on the pictures below for larger images and, in some cases, more information on each infographic. Links will open in a new tab.
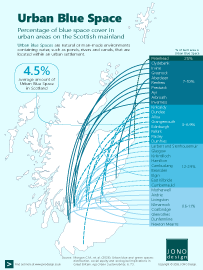
Urban Blue Space
Urban Blue Space refers to open water features within the built environment, such as rivers, canals, wetlands and lakes.
This infographic illustrates the amount of Urban Blue Space that is found in 35 urban settlements on the Scottish mainland.

5 Document Design Tips
Well designed documents not only look good but also read well, helping to get your message across to your audience.
This infographic provides 5 design tips on how to create better, more professional looking documents that represent your brand.

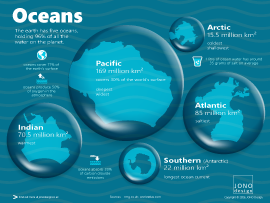
Oceans
The five oceans cover 71% of the world's surface. They play an important role in sustaining life - producing oxygen and absorbing carbon dioxide.
This infographic compares the size of the oceans, visualising them as water droplets.
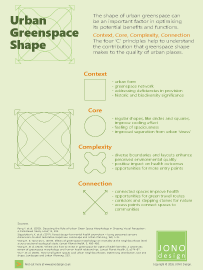
Urban Greenspace Shape
The shape of a greenspace can be an important element in optimising the potential benefits and functions that can be provided.
This infographic highlights four principles that help to understand the contribution that shape can make to creating good quality urban greenspaces.
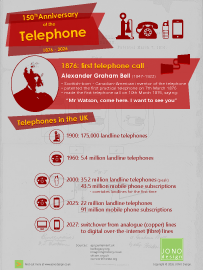
150th Anniversary of the Telephone
Alexander Graham Bell made the very first telephone call in March 1876, in Boston USA, just a few days after he patented his telephone invention.
This infographic marks the 150th anniversary of that historic event. It also provides a snapshot of the use of telephones in the UK.
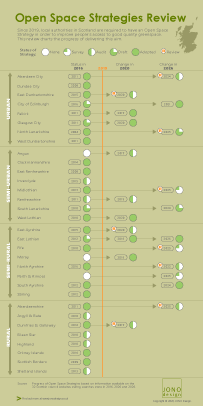
Open Space Strategies Review
In Scotland, local authorities are required to prepare and publish an Open Space Strategy. An up-to-date Open Space Strategy provides a better understanding of the demand and supply of open space and green networks in urban areas.
This infographic illustrates the status of Open Space Strategies across the 32 council areas in Scotland, charting the changes between 2016 and 2026.
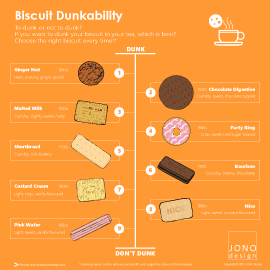
Biscuit Dunkability
If you are going to have a biscuit with tea or coffee, you may want to dunk – but which biscuit should you choose?
To help make the right choice, this infographic ranks a selection of biscuits that are British trea-time favourites in terms of their dunkability.
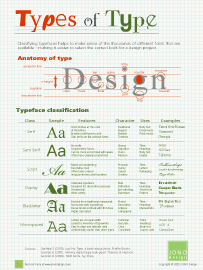
Types of Type
Which font style is right for your design project? Classifying similar fonts into groups can help make sense of the huge number of different typefaces that are available.
This infographic illustrates six main classes of type - a useful starting point in describing the different 'types of type'.
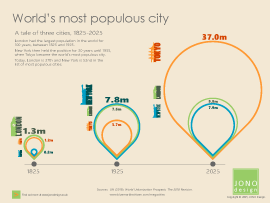
World's most populous city
The city with the largest population in the world has been a 'tale of three cities' over the last 200 years - the top spot being held by London, then New York and then Toyko.
This infographic uses proportionally sized shapes to demonstrate the scale of change over time.
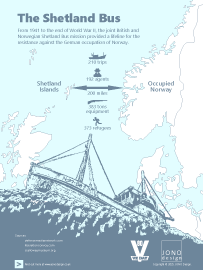
The Shetland Bus
During World War II, small boats provided a lifeline between Britain and German occupied Norway. The boats transported agents and supplies, and rescued those at risk from arrest.
This infographic remembers those who served in the boats, risking their lives on the often treacherous North Sea, and avoiding capture by enemy patrols.
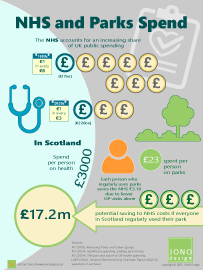
NHS and Parks Spend
The scale of funding for the NHS far exceeds that for parks and greenspaces.
This infographic illustrates the difference in the scale of funding, and highlights the potential contribution of greenspaces to improving the health of communities.
People using their greenspace could save the NHS in Scotland £17.2 million.
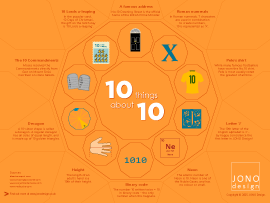
10 things about 10
This infographic marks the 10th anniversary of JONO Design by highlighting 10 interesting facts about the number 10.
This design uses decagons, 10-sided shapes, to provide a structure and background for the information. Each of the 10 facts is illustrated by an icon.
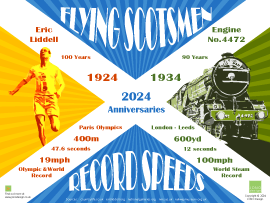
Flying Scotsmen
2024 marks the centenary of Eric Liddell's Gold medal win at the Paris Olyimpics, and the 90th anniversary of the first steam locomotive to achieve 100mph. Both have the nickname 'Flying Scotsman'.
This infographic, designed in a 'poster style', marks the anniversaries of the world record speeds of the 'Flying Scots'.
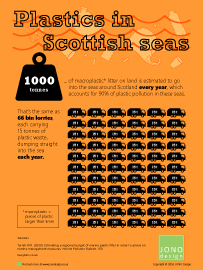
Plastics in Scottish Seas
1000 tonnes of macroplastic litter ends up in the seas around Scotland every year.
This infographic illustrates the scale of the plastic pollution. The amount of plastic pollution is equivalent to 66 bin lorries dumping their waste into the sea each year.
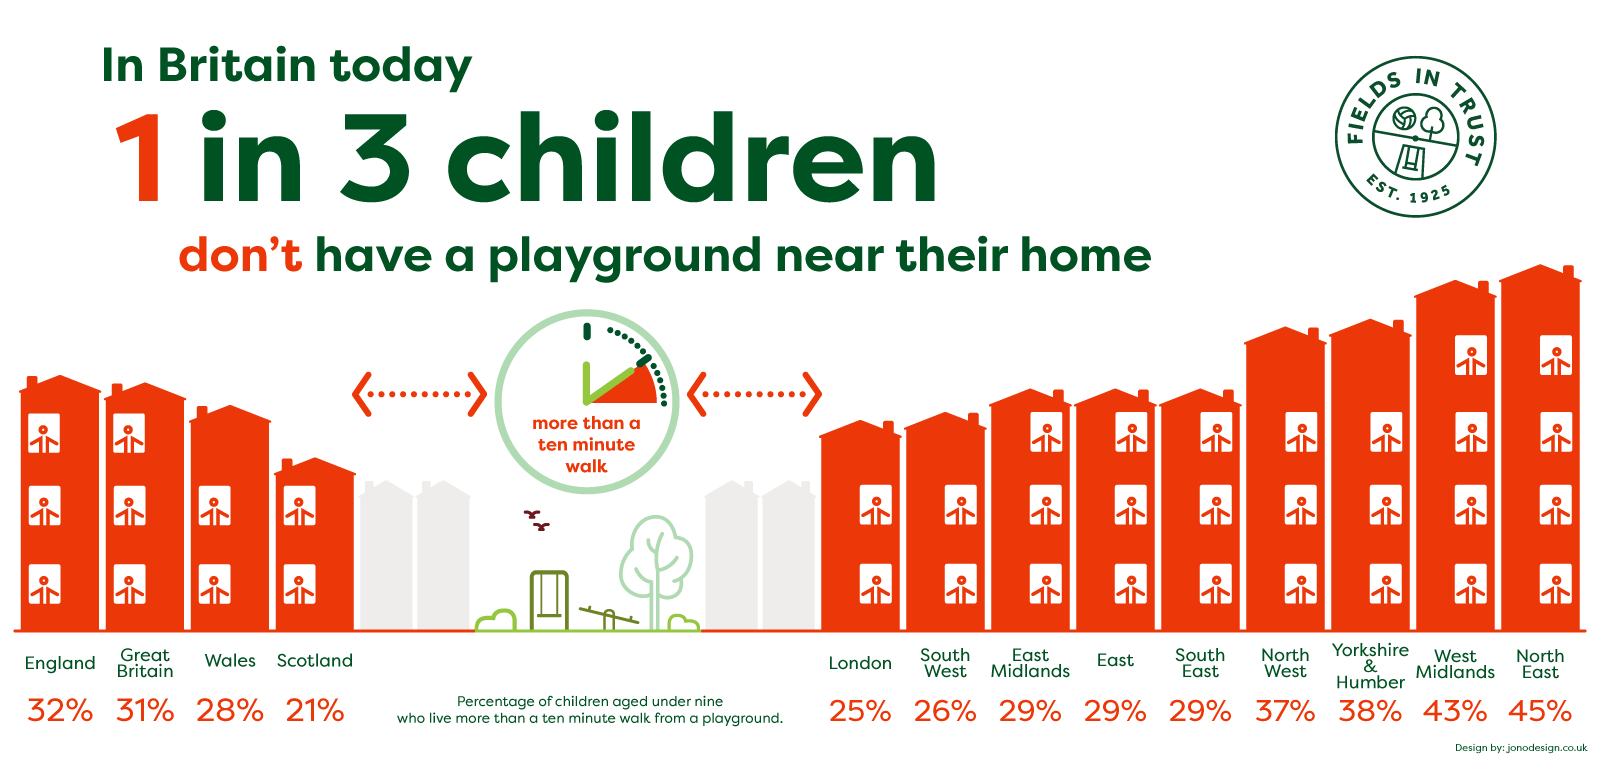
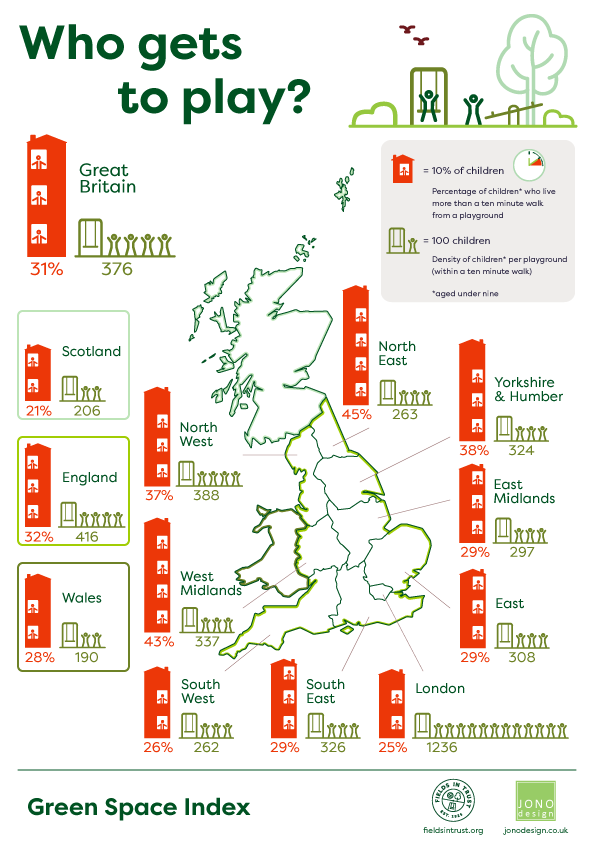
Who gets to play?
In Britain today, 1 in 3 children don't have a playground near their home.
JONO Design worked with Fields in Trust to visualise data on the amount of children that live further than a 10 minute walk from a playground. Two infographics were designed for the client's website, and two graphics were created for use on social media.

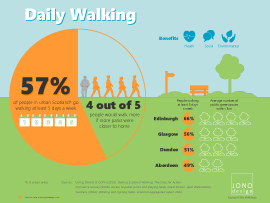
Daily Walking
More than half of people living in large urban areas of Scotland go for a walk at least five times a week.
This infographic illustrates that 4 out 5 people would walk more if there were more public greenspaces close to where they live. Therefore, access to greenspaces should be seen as an important element in encouraging healthier lifestyles.
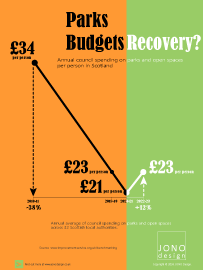
Parks Budgets Recovery?
The amount spent on parks by Scottish councils has been falling for a decade.
This infographic shows an upward trend in the last couple of years. But does this indicate the green shoots of recovery in the longer term?
The design uses colour to illustrate the change in direction of funding for parks.
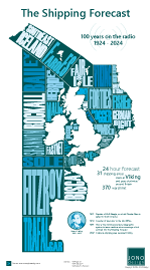
The Shipping Forecast
This infographic marks 100 years of the forecast being broadcast on the radio, 1924-2024.
The named shipping areas are illustrated in the seas around the British Isles.
The design evokes a 'newspaper' style, using a limited colour palette and large type.
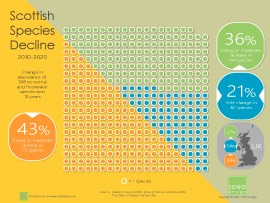
Species Decline
Almost half of the wildlife species in Scotland are in decline, as illustrated in this infographic.
Each dot on the infographic represents one of 398 species, which have been monitored over a 10-year period.
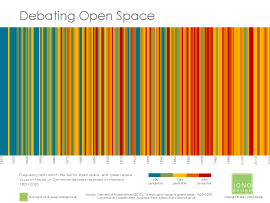
Debating Open Space
The infographic visualises the frequency of references to 'open space' and 'green space' made in the House of Commoms between 1820 and 2020.
The 'hotter' the colour, the higher the number of references that occur in a given year.
Forty Infographics
Each issue of JONO Design e-news has included a brand new infographic.
This infographic is the 40th to be published, and illustrates the variety of ways – from maps, to charts and diagrams – that JONO Design has used infographics to visualise data and information and tell a story.

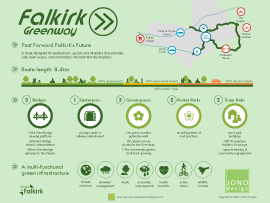
Falkirk Greenway
The Falkirk Greenway is a concept for a new route for pedestrians, cyclists and wheelchair users.
The infographic illustrates that the new route would link visitor attractions to the town centre, creating new greenspaces and new green infrastructure through the urban environment.
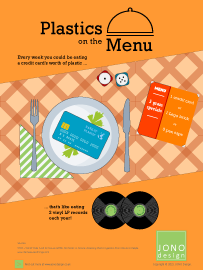
Plastics on the Menu
Tiny plastic particles pollute our environment and end up in the water and food that we eat.
The infographic illlustrates that each week we eat an amount of plastic equivalent to a credit card!
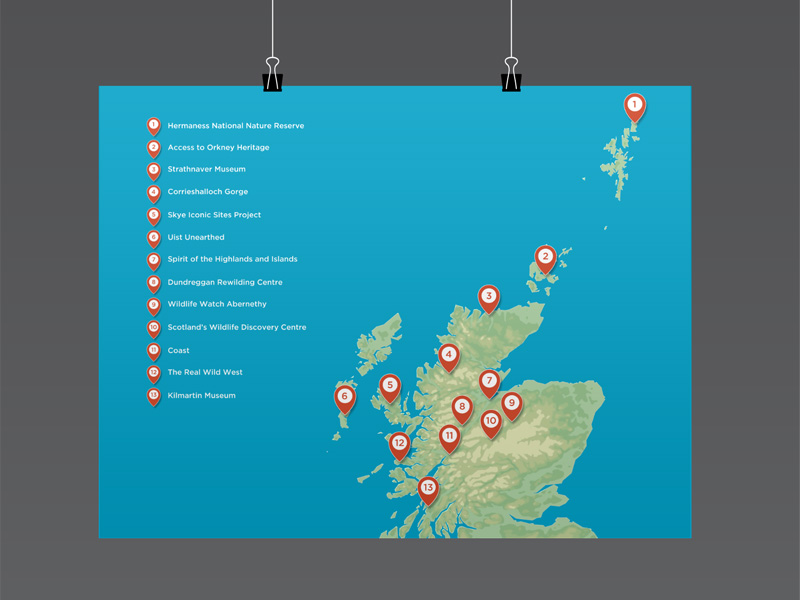
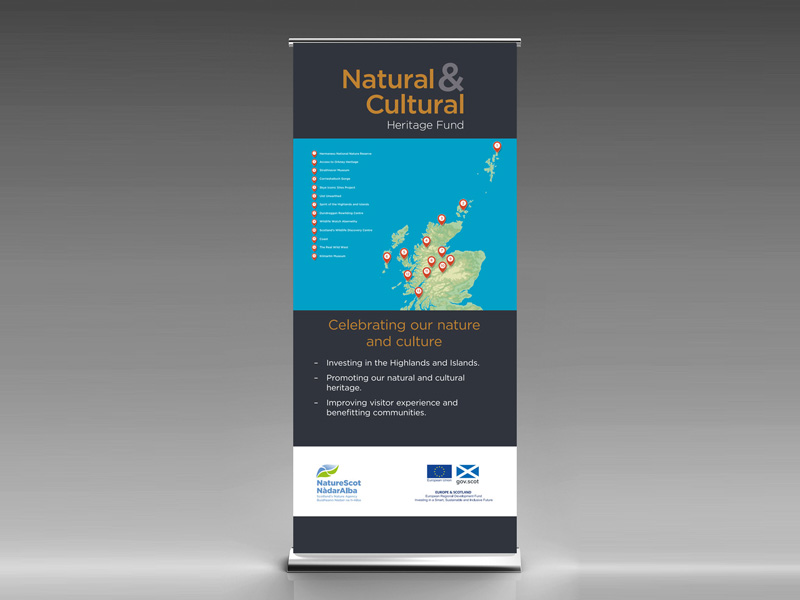
Natural & Cultural Heritage Fund Map
To design a map showing the location of projects supported by the fund, for display in a pull-up banner.
The design uses a stylised relief map of Scotland set against a bold colour background. Numbered map markers indicate where the projects are located, and a key shows the name of each project.
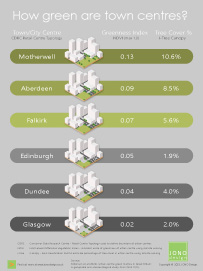
How Green are Town Centres?
Town centres are at the heart of our urban areas. However, they are undergoing a period of change and green infrastructure has a role to play in creating sustainable and attractive centres for the future.
The infographic demonstrates how green the centres are of the six most populated cities and large towns in Scotland.
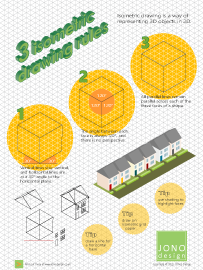
Isometric Drawing Rules
Isometric drawing is one method for creating 3D pictures in 2D. The technique is used to create everything from flatpack furniture instructions to graphic illustrations.
The infographic illustrates the three basic rules for creating isometric drawings, and also provides three tips to getting started.
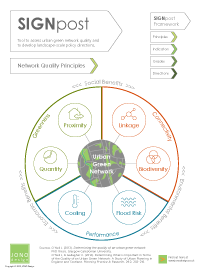
Urban Green Network Quality
A network of greenspaces (a green infrastructure) is widely accepted as integral to sustainable development. However, it can be difficult to translate the concept into policies that deliver a network that is of good quality.
The infographic highlights six principles that are important in understanding what makes a good quality urban green network as a whole.
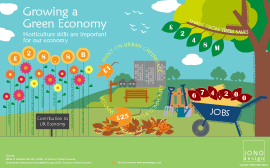
Growing a Green Economy
Horticulture skills are important for our economy and for ensuring the quality of urban greenspaces.
The infographic uses a cheerful, illustrative style to illustrate four ways that the ornamental horticultural and landscaping services sector contributes economic, social and environmental benefits.
Falkirk Canal -
Flotilla 200 Event
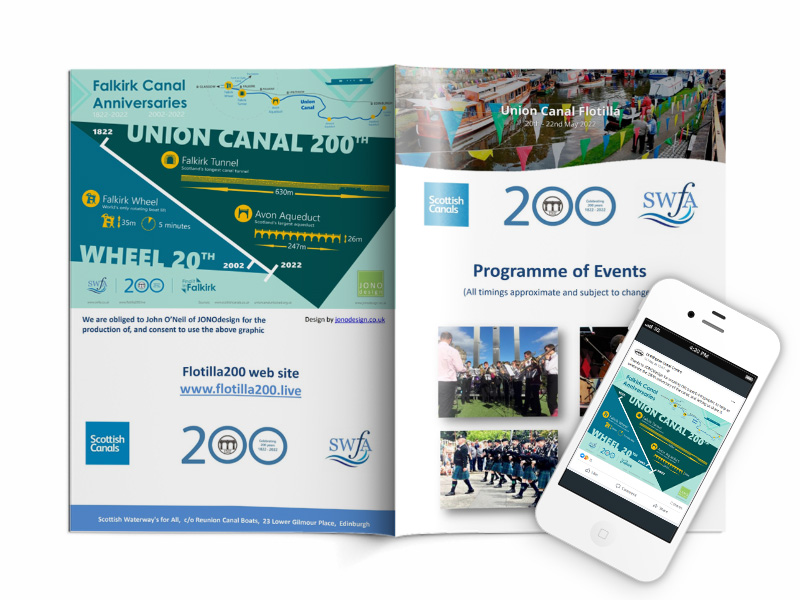
Scottish Waterways for All asked for permission to use the 'Falkirk Canal Anniversaries' infographic to promote the Flotilla 200 events marking the 200th anniversary of the Union Canal.
The infographic appeared on the back page of the events programme and on social media platforms.
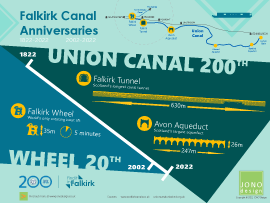
Falkirk Canal Anniversaries
This infographic celebrates the 200th anniversary of the Union Canal and the 20th anniversary of the Falkirk Wheel.
The major engineering marvels that are the Falkirk Tunnel, Avon Aqueduct and the Falkirk Wheel are highlighted in the infographic - all of which can be found in Falkirk and the surrounding area.
Greenspace Funding guest blog
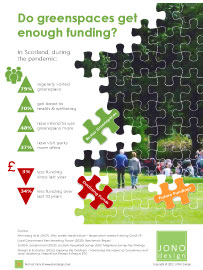
greenspace scotland invited JONO Design to write a guest blog around the 'Greenspace Funding' infographic to highlight the issue of managing and maintaining parks and open spaces.
A banner and a letterbox version of the infographic was provided for greenspace scotland to use on their website, social media and e-newsletter.

Greenspace Funding
Greenspaces are getting busier, while funding is in decline. This infographic asks whether the amount of funding for greenspace is adequate.
The design uses jigsaw shapes to illustrate the need to properly fund public greenspaces so that they are good quality community resources that people can enjoy.
UK National Parks
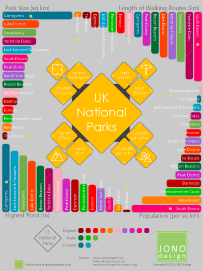
There are 15 National Parks in Britain. This infographic compares the parks against size, highest point, length of walking routes and population density.
The design uses simple bar charts, but orientates them around the edge to create a dynamic and interesting graphic. Each park is denoted by a different colour to allow easy recognition.
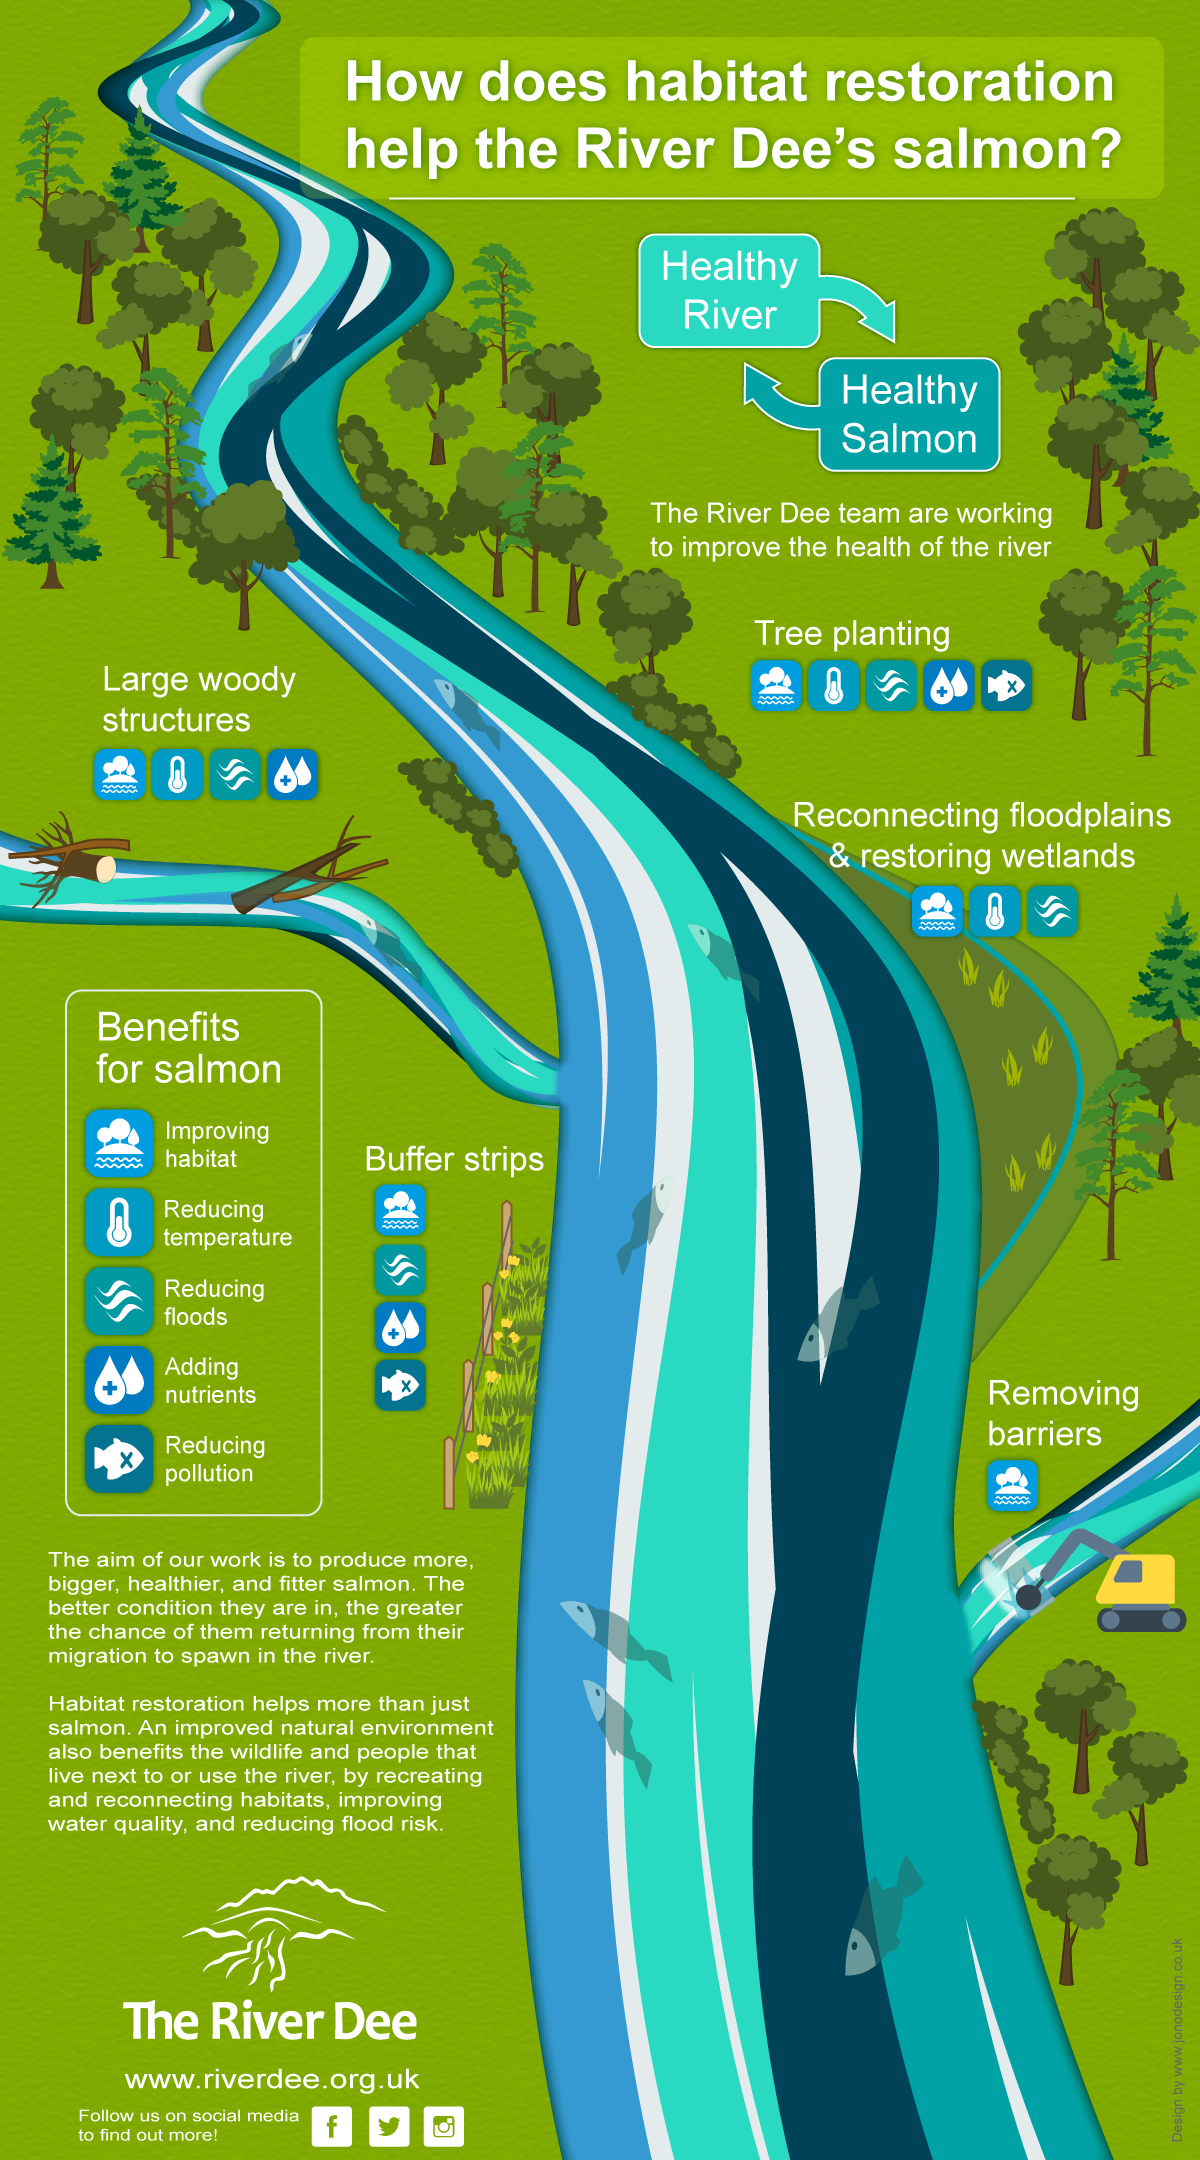
River Habitat Restoration
To design an infographic that illustrates the work of the River Dee Trust to improve the health of salmon through restoring the river habitat. Improving the habitat will also significantly benefit the wider ecosystem and people.
The design of the river evokes moving water. Icons identify the benefits to salmon that the restoration activities will provide.
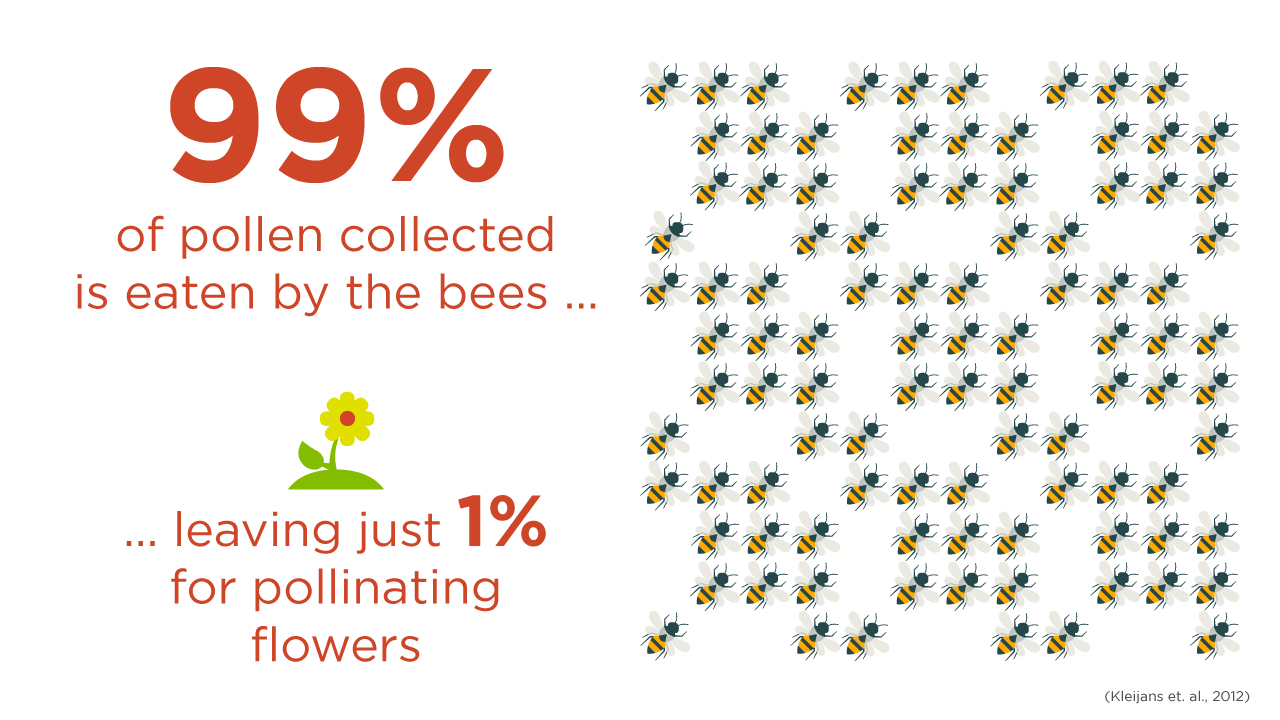
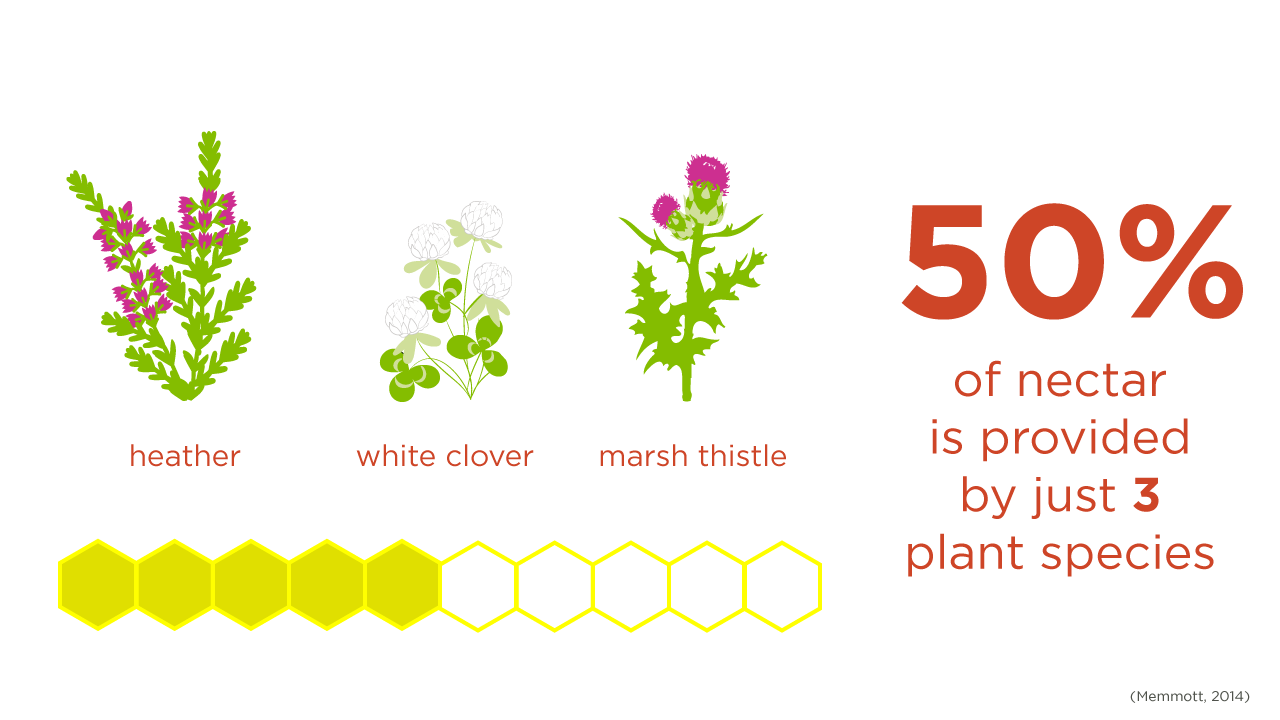
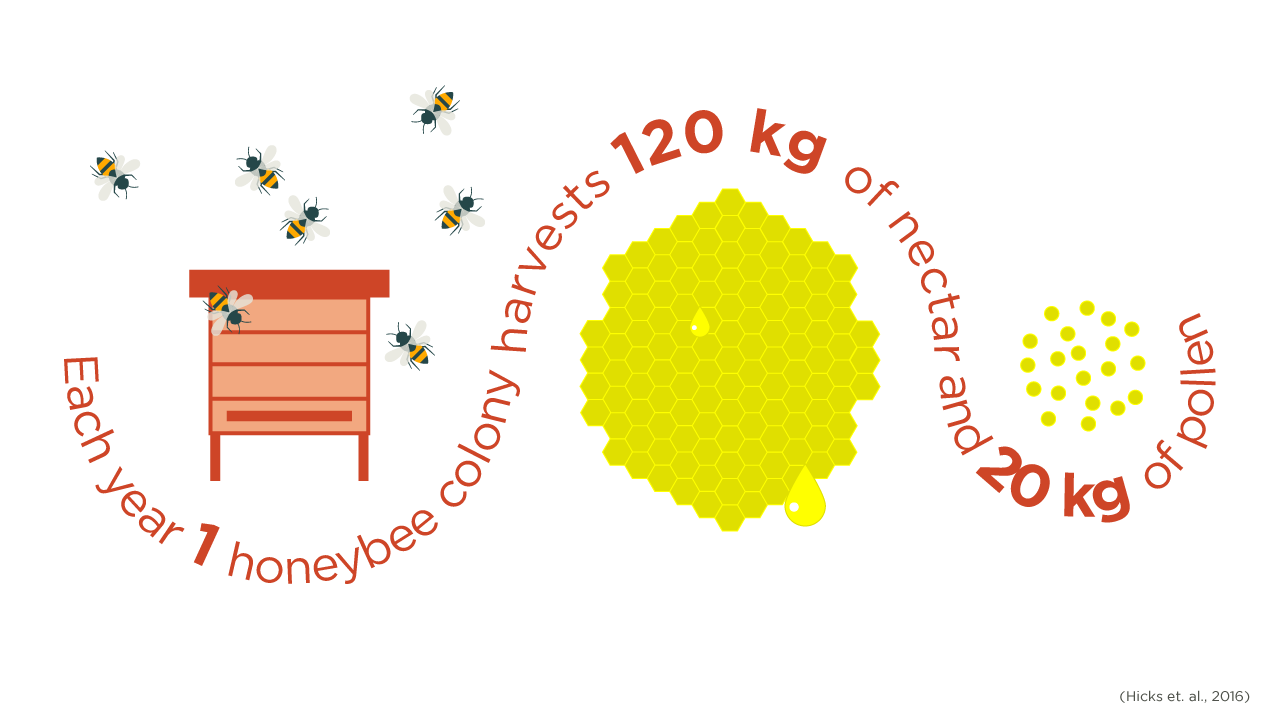
Pollinators
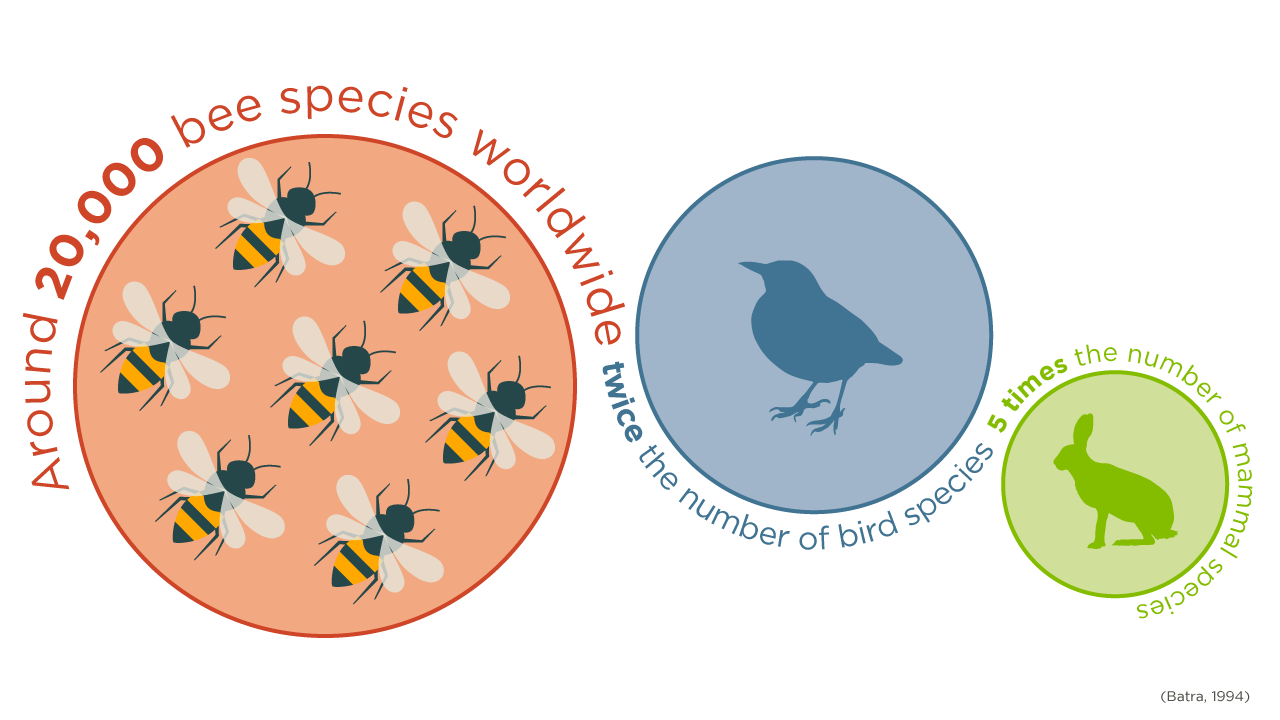
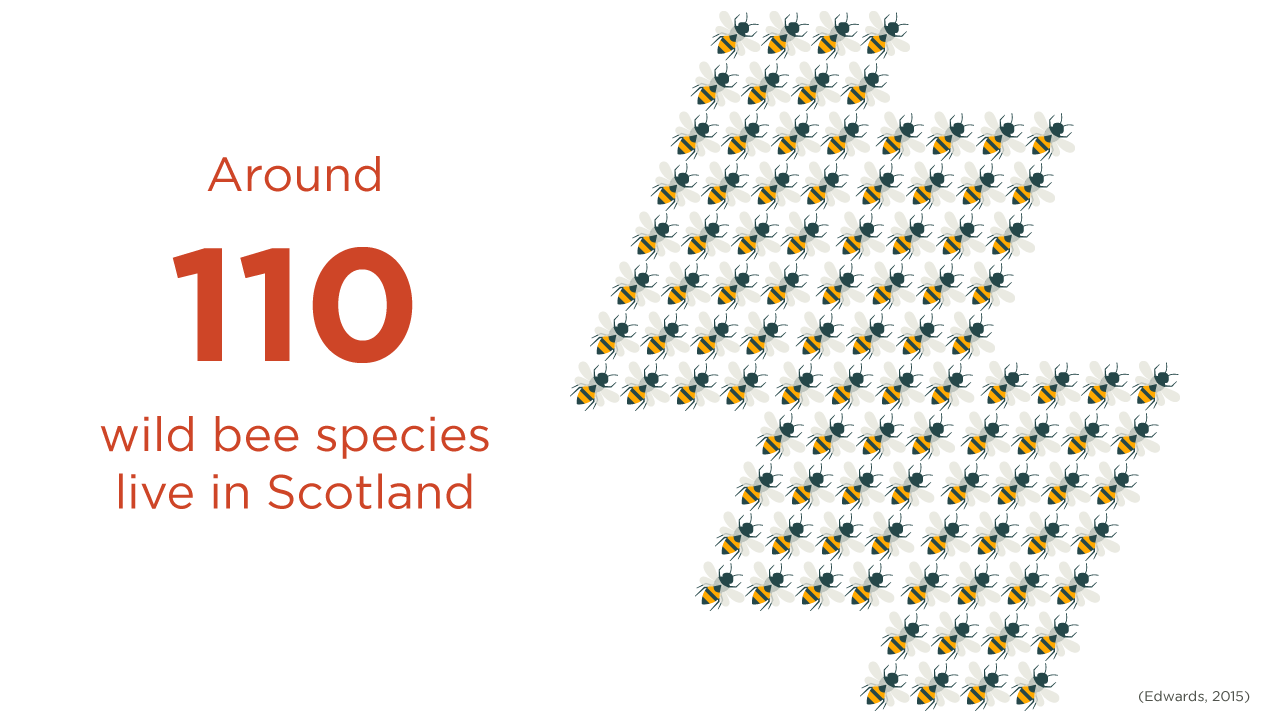
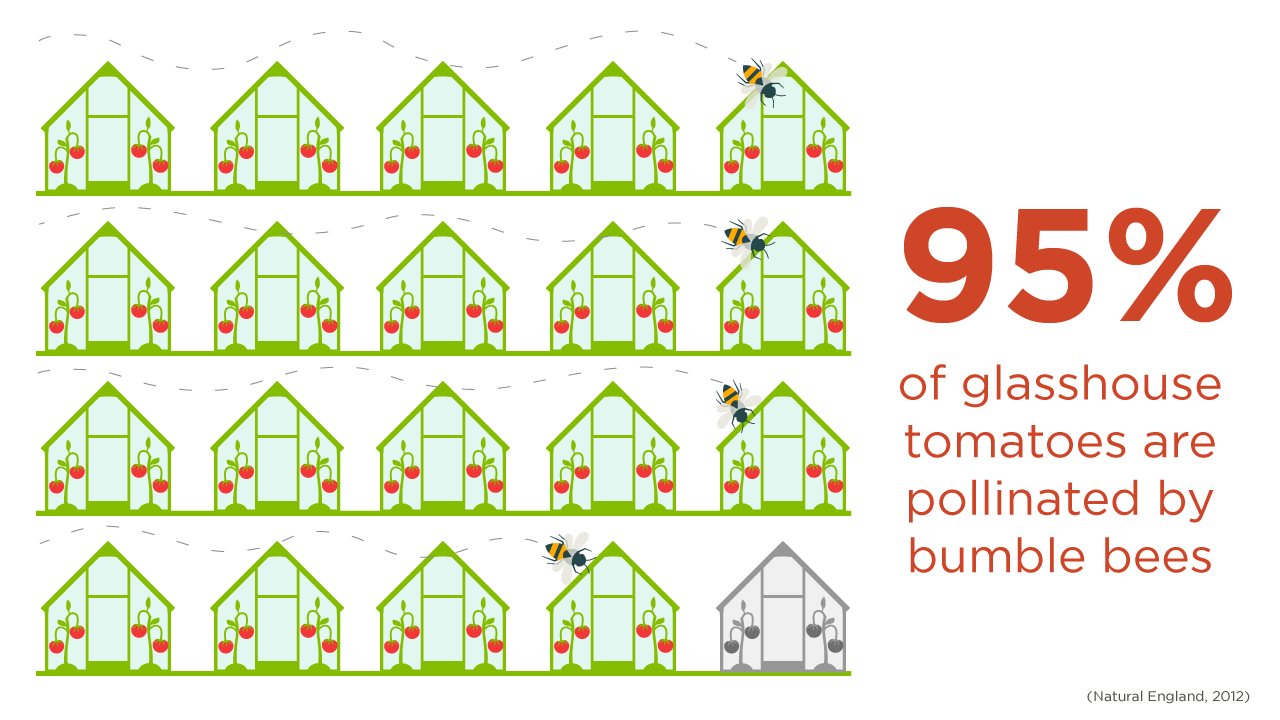
To design six infographics for NatureScot to use on social media that illustrate key facts about pollinators.
Each infographic displays data using icons that represent quantities, and shapes that are proportional in size to illustrate differences. The use of colours, font and icons creates a consistent design style.
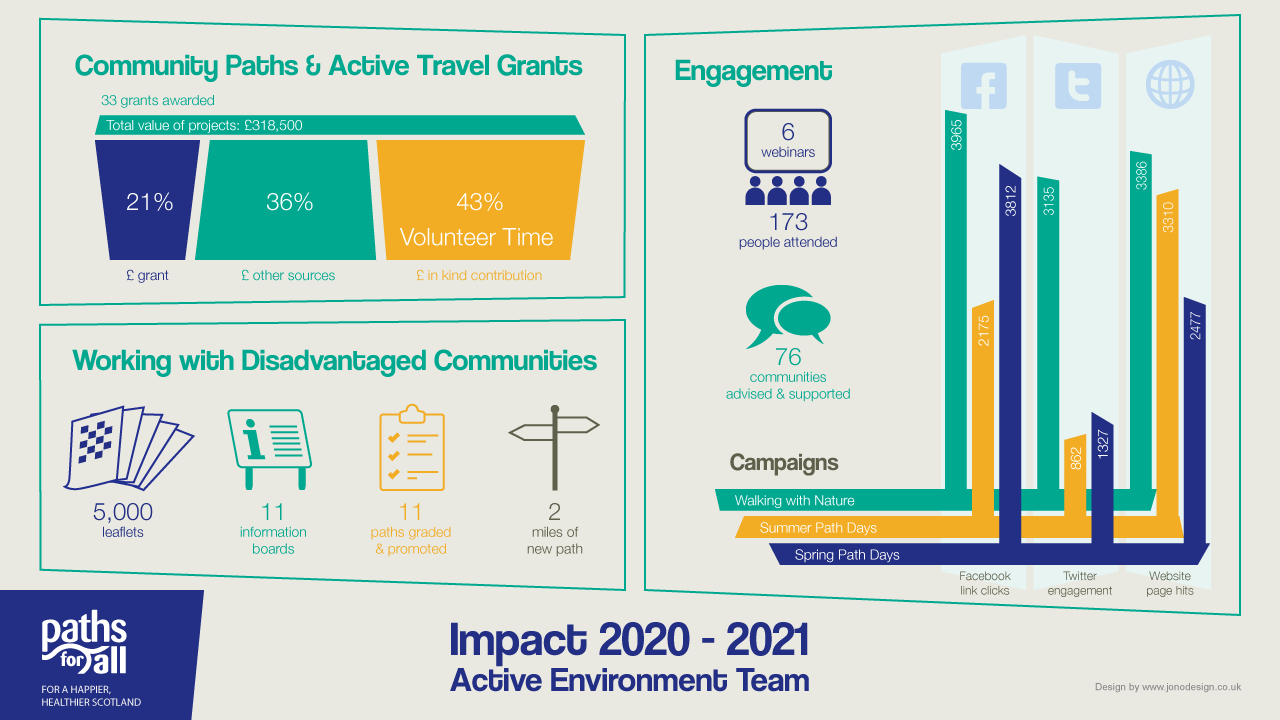
Promoting an Active Environment
To design an infographic that illustrates the impact of the work done by Paths for All's Active Environment Team.
The design of the infographic applies the client's brand style, colours and font. The graphic elements demonstrate: the added value of grants; the work with communities; engagement activites; and the results of social media campaigns.
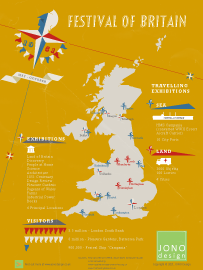
Festival of Britain
The 1951 Festival of Britain showcased the best of British design and industry, and provided a morale boost in the post-war period.
The infographic illustrates the exhibitions and travelling displays that took place in cities all across the country. It is thought that around half of the population participated in the festival in some way.
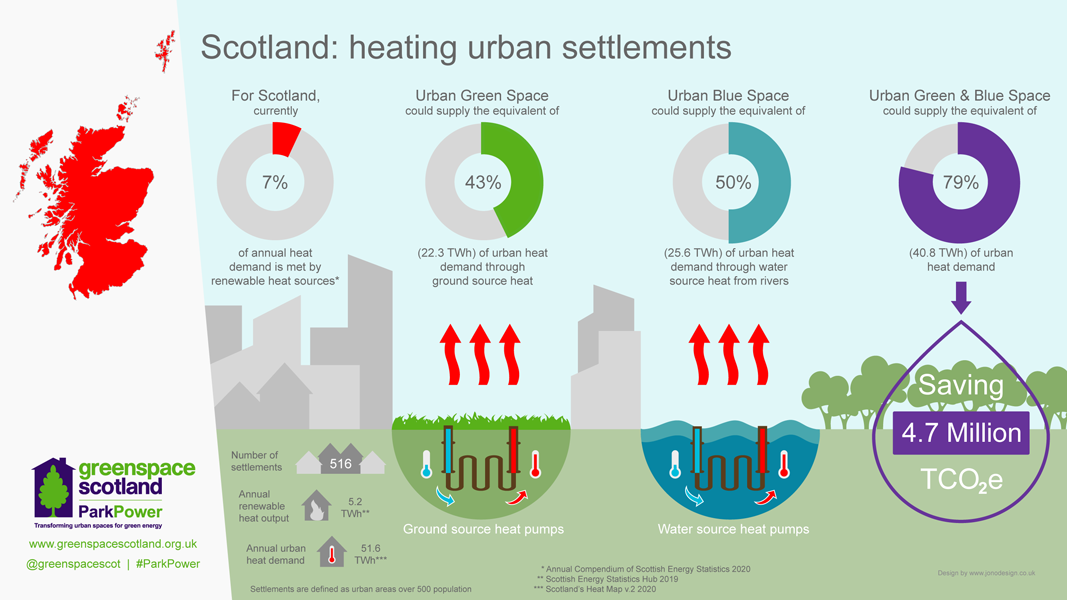
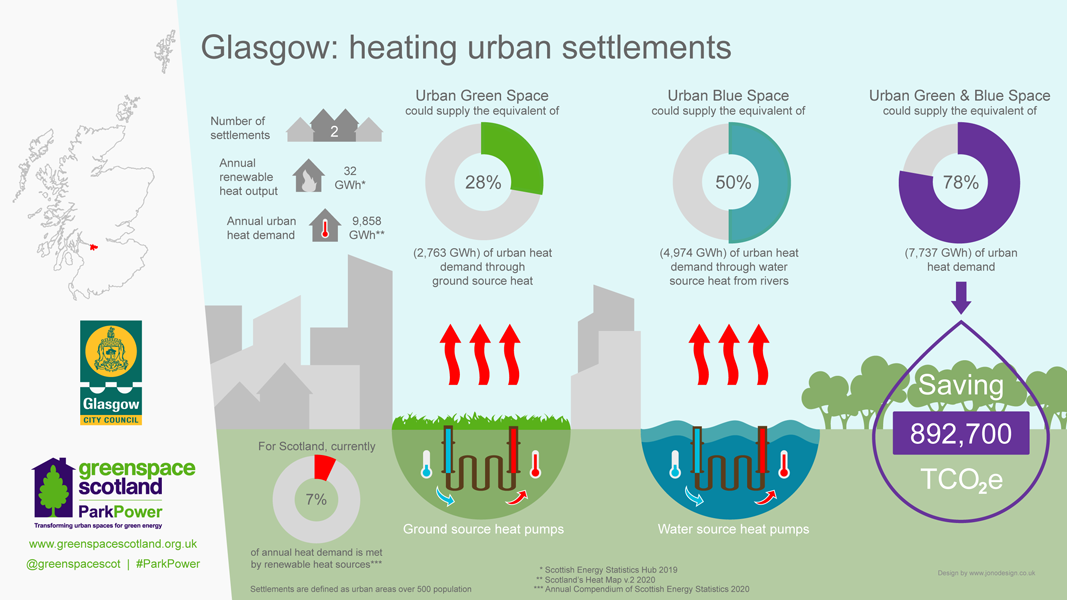
Green Heat in Greenspaces
To design 15 infographics that illustrate the potential for low carbon renewable heat sources to heat almost 80% of homes in urban Scotland.
The infographics display data at the national, regional or local authority level. Doughnut charts illustrate the gap between the existing and potential supply of heat from ground and water sources.
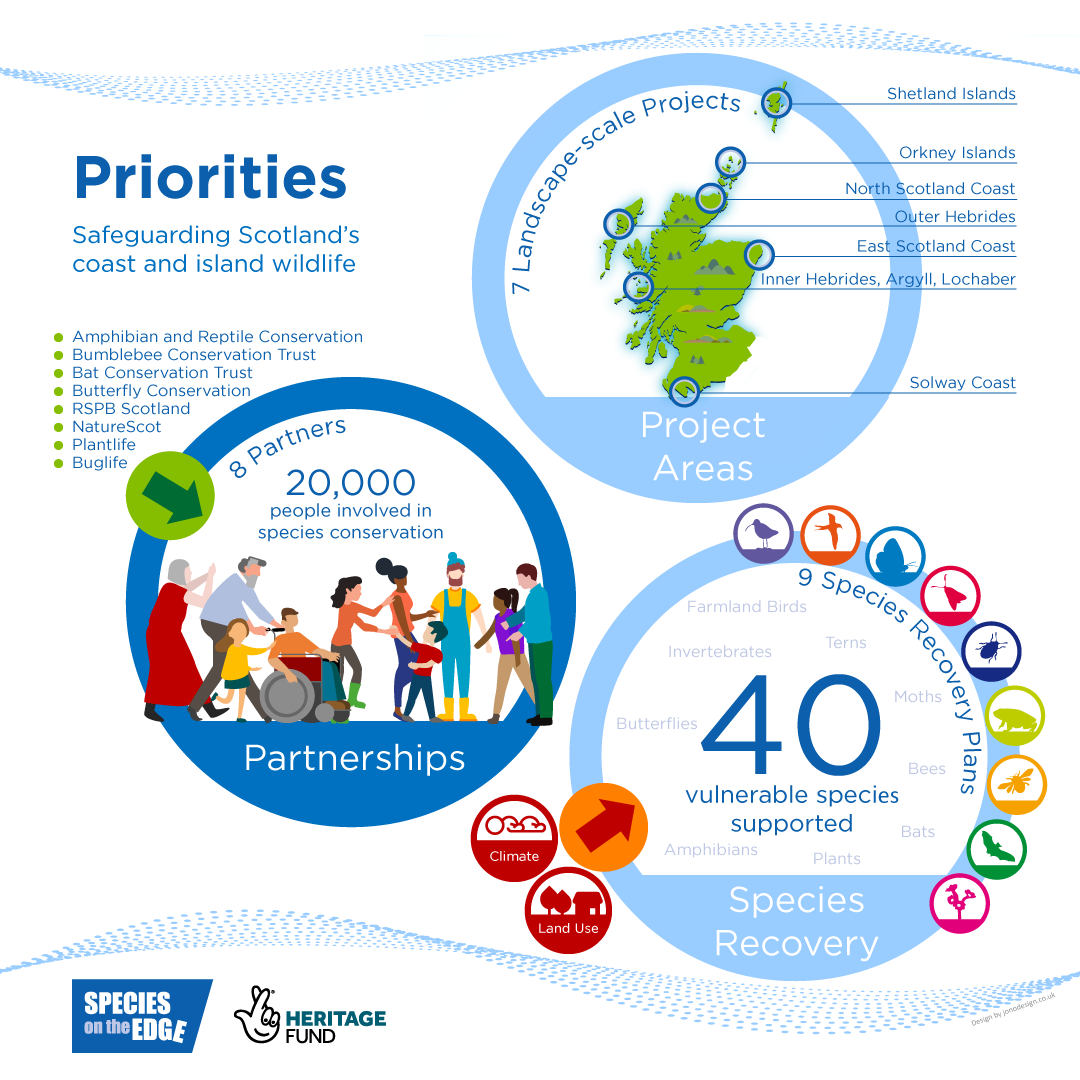
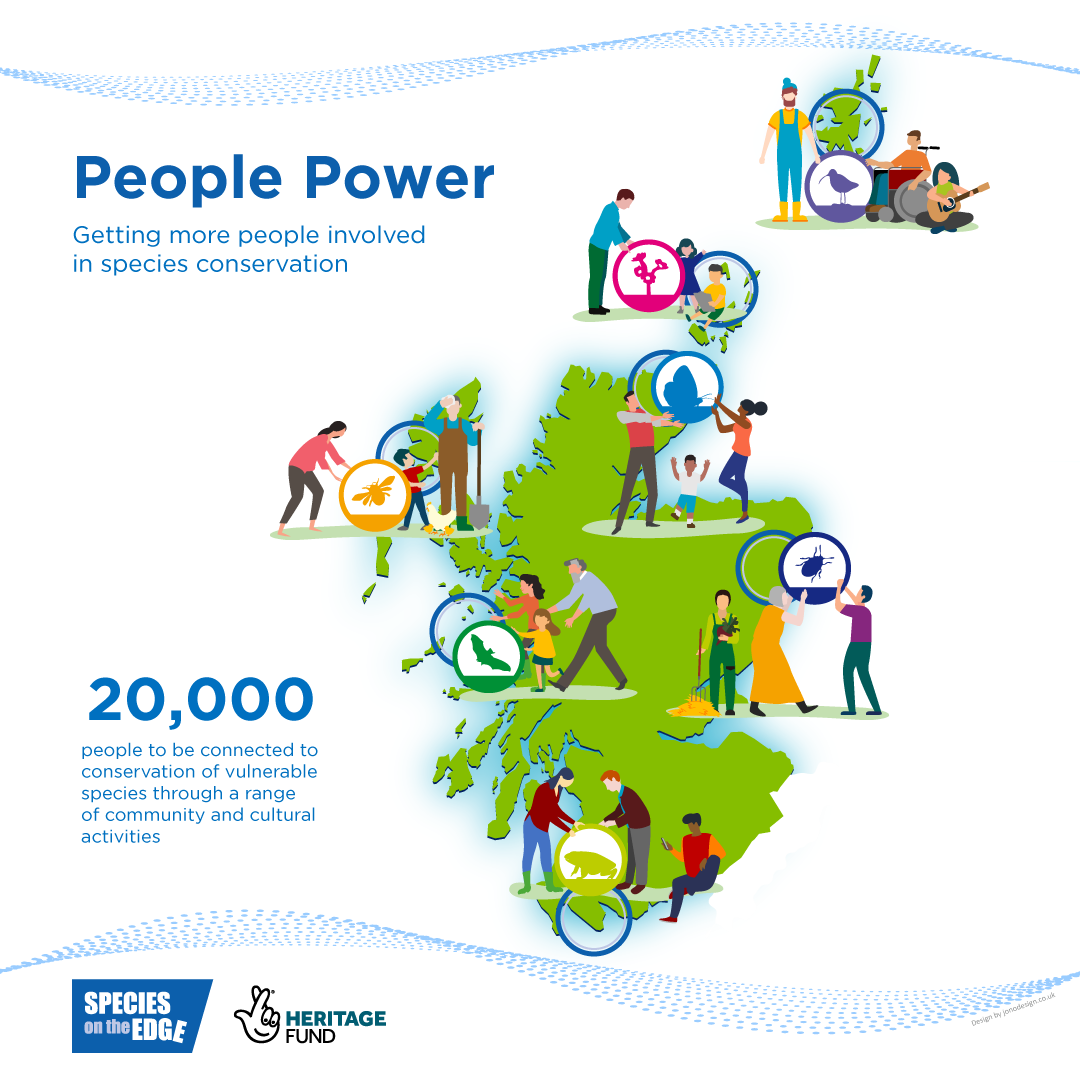
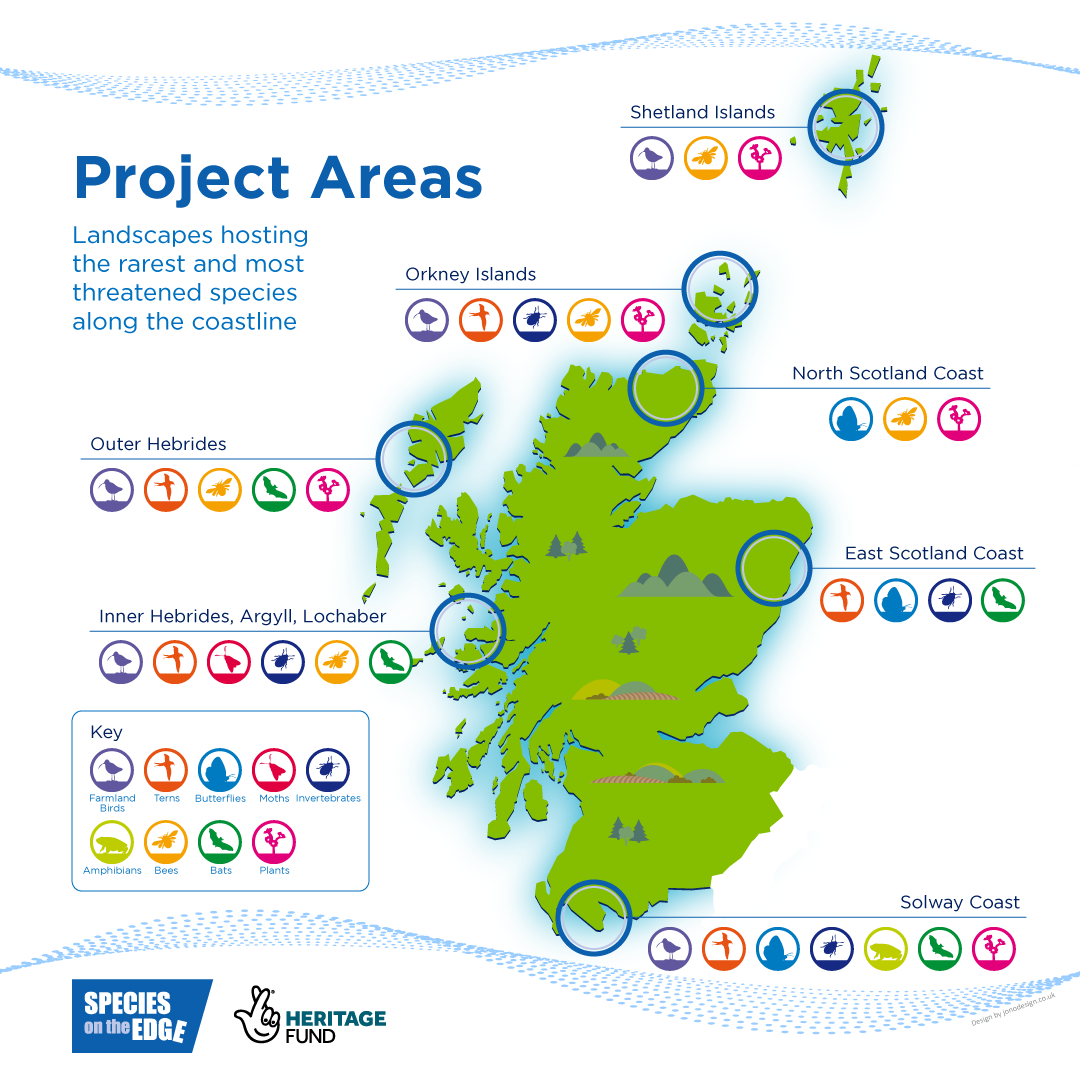
Species on the Edge
To design 3 infographics to illustrate the objectives, public engagement and project areas of the initiative, which aims to encourage more people into conservation.
The colours and wave design reflect the coastal nature of the projects. The design conveys a bright friendly feel. Colours and elements are shared across the images to tie them together as a set.
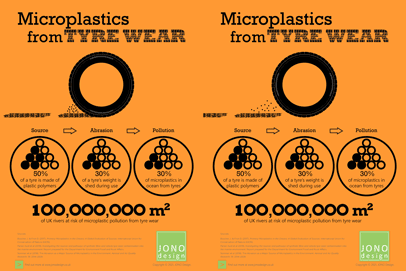
Microplastics from Tyre Wear
Tyre wear is a major contributor of microplastics that pollute our environment.
The animated infographic illustrates the scale of the problem. Rivers appear to be particularly at risk of pollution from this source, with consequences for water and habitat quality.
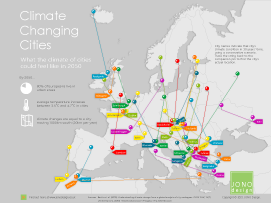
Climate Changing Cities
Visualising the effects of climate change can illustrate how it will affect people's lives.
The infographic shows what the climate of European cities could feel like in 30 years time, a period when average temperatures are expected to rise significantly.
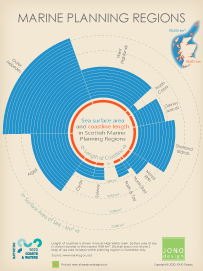
Marine Planning Regions
This infographic compares the surface area of sea and the length of coastline included in each of the 11 Scottish Marine Planning Areas.
The Outer Hebrides Marine Region is the largest, with almost a quarter of the total area of sea and a fifth of the Scottish coastline.
Why Choose JONO Design?
This infographic illustrates what it is like working with JONO Design, using feedback from our clients.
You can expect great customer service, creative design solutions and high-quality results.

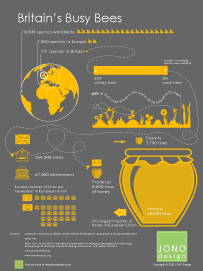
Britain's Busy Bees
This infographic illustrates the number of bee species found in Britain and highlights their importance as pollinators.
The infographic also demonstrates the scale of British beekeeping and natural honey production, which is small compared to the European average.
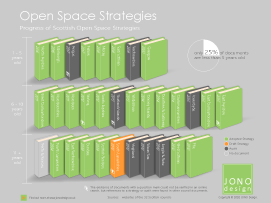
Open Space Strategies
Strategies are key to improving our understanding of open space - its amount, quality, accessibility and functions. They identify where improvements can be made.
The infographic provides a snapshot of the coverage of Strategies across the 32 Scottish councils.
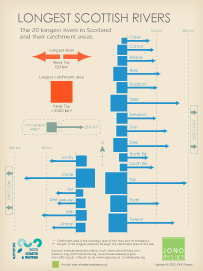
Longest Scottish Rivers
Scotland's twenty longest rivers that flow into the sea are depicted in this infographic.
The catchment area and length of each of the rivers is shown. The River Tay is Scotland's longest river and it also has the largest catchment area.
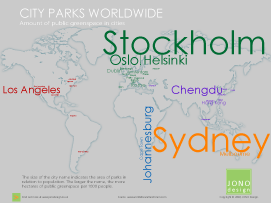
City Parks Worldwide
Parks are an important feature of urban areas.
The infographic illustrates the amount of publicly accessible greenspace in relation to population for a variety of cities around the world.
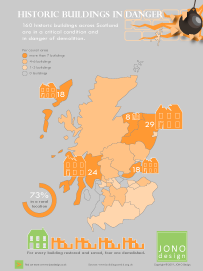
Historic Buildings in Danger
Historic buildings that fall into disuse and disrepair are at risk of being lost if they are not restored.
The infographic highlights where buildings of historic or architectural interest in Scotland are in danger of being demolished.
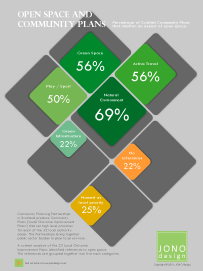
Open Space and Community Plans
Community Plans set high-level priorities for each of the Scottish local authority areas.
Open space is an important part of the places where we live. The infographic highlights how Plans have taken aspects of open space into account.
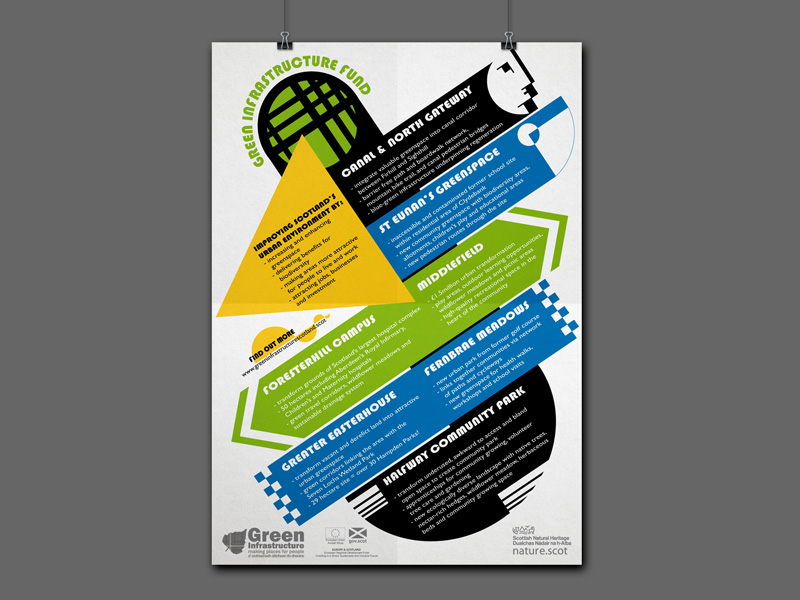
Green Infrastructure Fund Projects Infographic Poster
To design a text-based A2 poster to highlight the aims and benefits of projects being funded by the programme.
The poster uses the client's corporate colours in a Bauhaus-inspired design adapted from a previous infographic (see below). Developing an existing design is a cost-effective way of creating a new infographic.

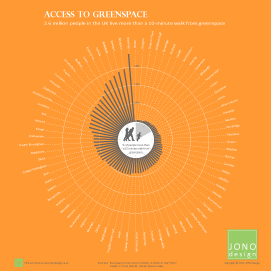
Access to Greenspace
Providing greenspace close to people's homes is an important indicator of the quality of an urban area as a place to live.
The infographic illustrates the number of people in the UK that live more than a 10-minute walk from greenspace.
Improving Agri-environment Schemes
Agri-environment schemes encourage farmers to adopt environmental management practices.
The infographic highlights the ways that schemes could be more effective in delivering benefits for wildlife and the environment.

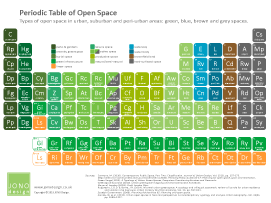
Types of Open Space
There is a wide variety of different types of open space found in urban areas.
This infographic uses the Periodic Table of elements as a design form to show in a clear way a complex range of different types of green, blue, brown and grey space.
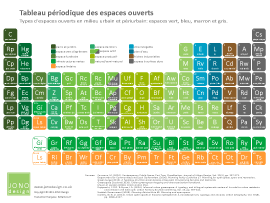
Also available in French.
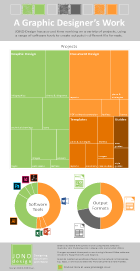
A Graphic Designer's Work
Graphic designers work on a wide variety of projects to produce outputs for use online and within printed materials.
The infographic visualises the creative work of JONO Design by illustrating the types of projects, software tools and outputs which JONO Design uses.
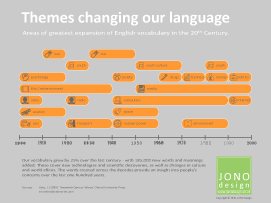
Themes Changing Our Language
The English vocabulary is constantly evolving in response to new technologies and changes in society.
The infographic displays the main themes that influenced the creation of new words and terms during the 20th Century.
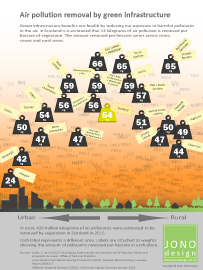
Air Pollution Removal
Green infrastructure removes harmful pollution from the air, benefiting our health.
The infographic illustrates the amount of air pollution estimated to be removed by green infrastructure in Scotland.
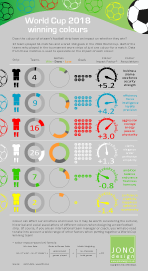
World Cup Winning Colours
Teams wore strips in a variety of colours at the 2018 Football World Cup.
The infographic takes a playful look at whether colours had an impact on team performances in the tournament.
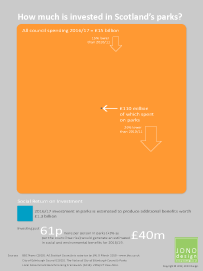
How Much is Invested in Scotland's Parks?
This infographic ahows the amount invested in parks and greenspaces by councils in Scotland, and compares it to their total expenditure.
The parks budget is just a tiny fraction of all council spending, but delivers significant additional benefits.
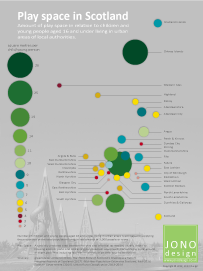
Play Space in Scotland
This infographic illustrates the amount of open space for play and informal recreation provided for children and young people across urban Scotland.
In Scotland as a whole, there are six square metres of play space per child/young person.
5 Reasons to Choose Word to Design Documents
This infographic illustrates that Microsoft Word is a popular, practical, customisable, versatile and convenient software choice to design a wide range of documents.
Attractive and professional looking documents can be designed using Word and published online or in print.

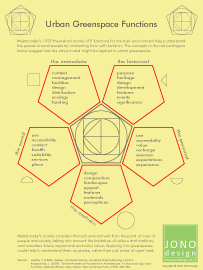
Urban Greenspace Functions
The infographic illustrates how Jan Mukarovsky's model of built environment functions could be applied when assessing urban greenspaces.
Applying the model could help to understand the value and quality of our greenspaces by considering how they meet people's needs.
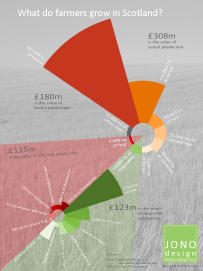
What do Farmers Grow in Scotland?
This infographic illustrates the crops that are grown on farms in Scotland. The areas of land given over to growing crops, such as cereals, vegetables and fruit, are shown in proportion to each other.
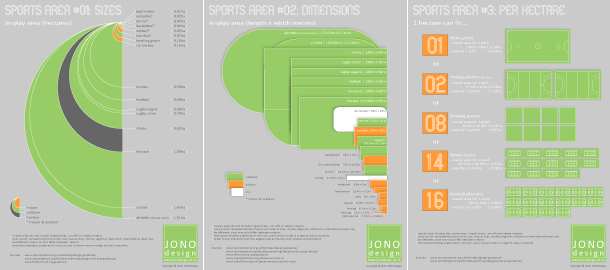
Sports Area infographics
These 3 infographics each provide a different way of comparing the size of the play area for a selection of sports. The infographics compare the size and dimensions of various pitches and courts, and also show how many play areas can fit into a hectare.
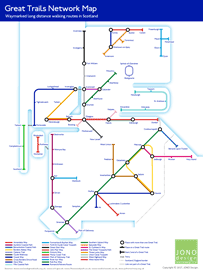
Great Trails Network Map
The infographic shows the 28 long distance walking routes in Scotland that are classed as Great Trails.
The design of the Great Trails Network Map follows the style of the London Underground map, using the same principles, font and colours.
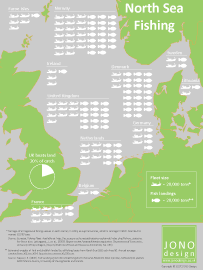
North Sea Fishing
This infographic illustrates the amount of fish caught in the North Sea by different national fleets.
An ISOTYPE technique (use of symbols) shows the sizes of the fishing fleets, plus the estimated weight of fish and shellfish landed.
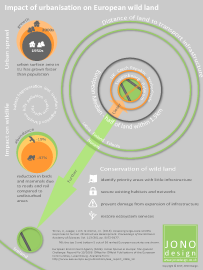
Impact of Urbanisation on European Wild Land
The infographic illustrates research which has found that half of all land in Europe is 1.5km from a road or railway.
The proximity of urban infrastructure has a negative effect on wildlife. Strategies to protect wild land from inappropriate development are identified.
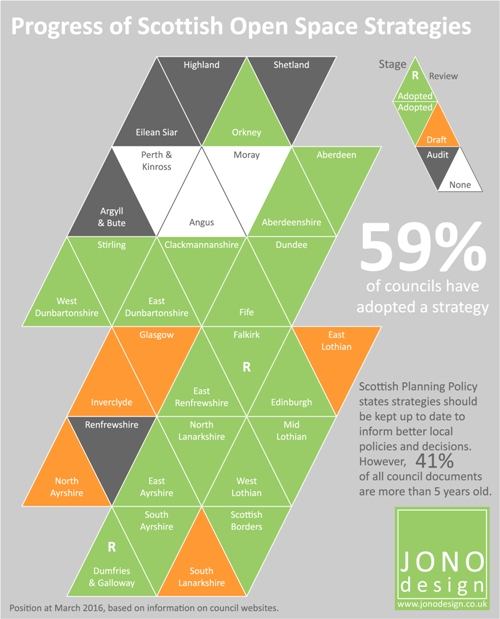
Open Space Strategies and Spending on Parks
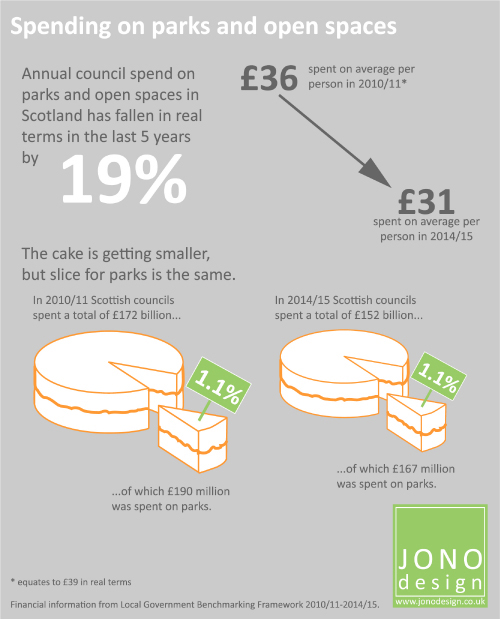
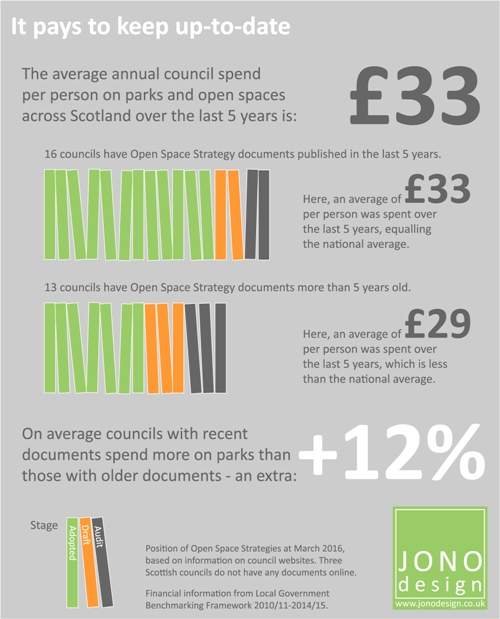
These 3 infographics highlight the progress of Open Space Strategies in Scotland, comparing this with how council spending on parks has changed over time, and illustrating the importance of keeping strategies up-to-date.
Click on the pictures for larger images. Links will open in a new window.
Get in touch to discuss your design requirements
or to request a quote.

enquiries@jonodesign.co.uk

Copyright © 2015-2026 JONO Design.
Designing solutions with Word